
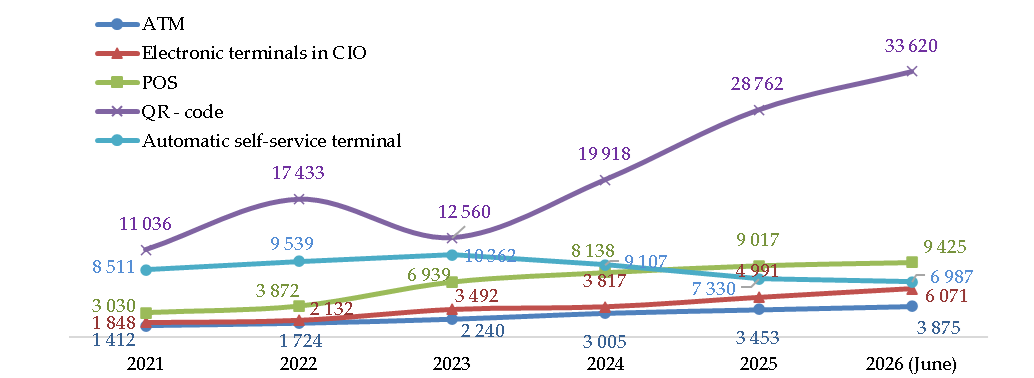
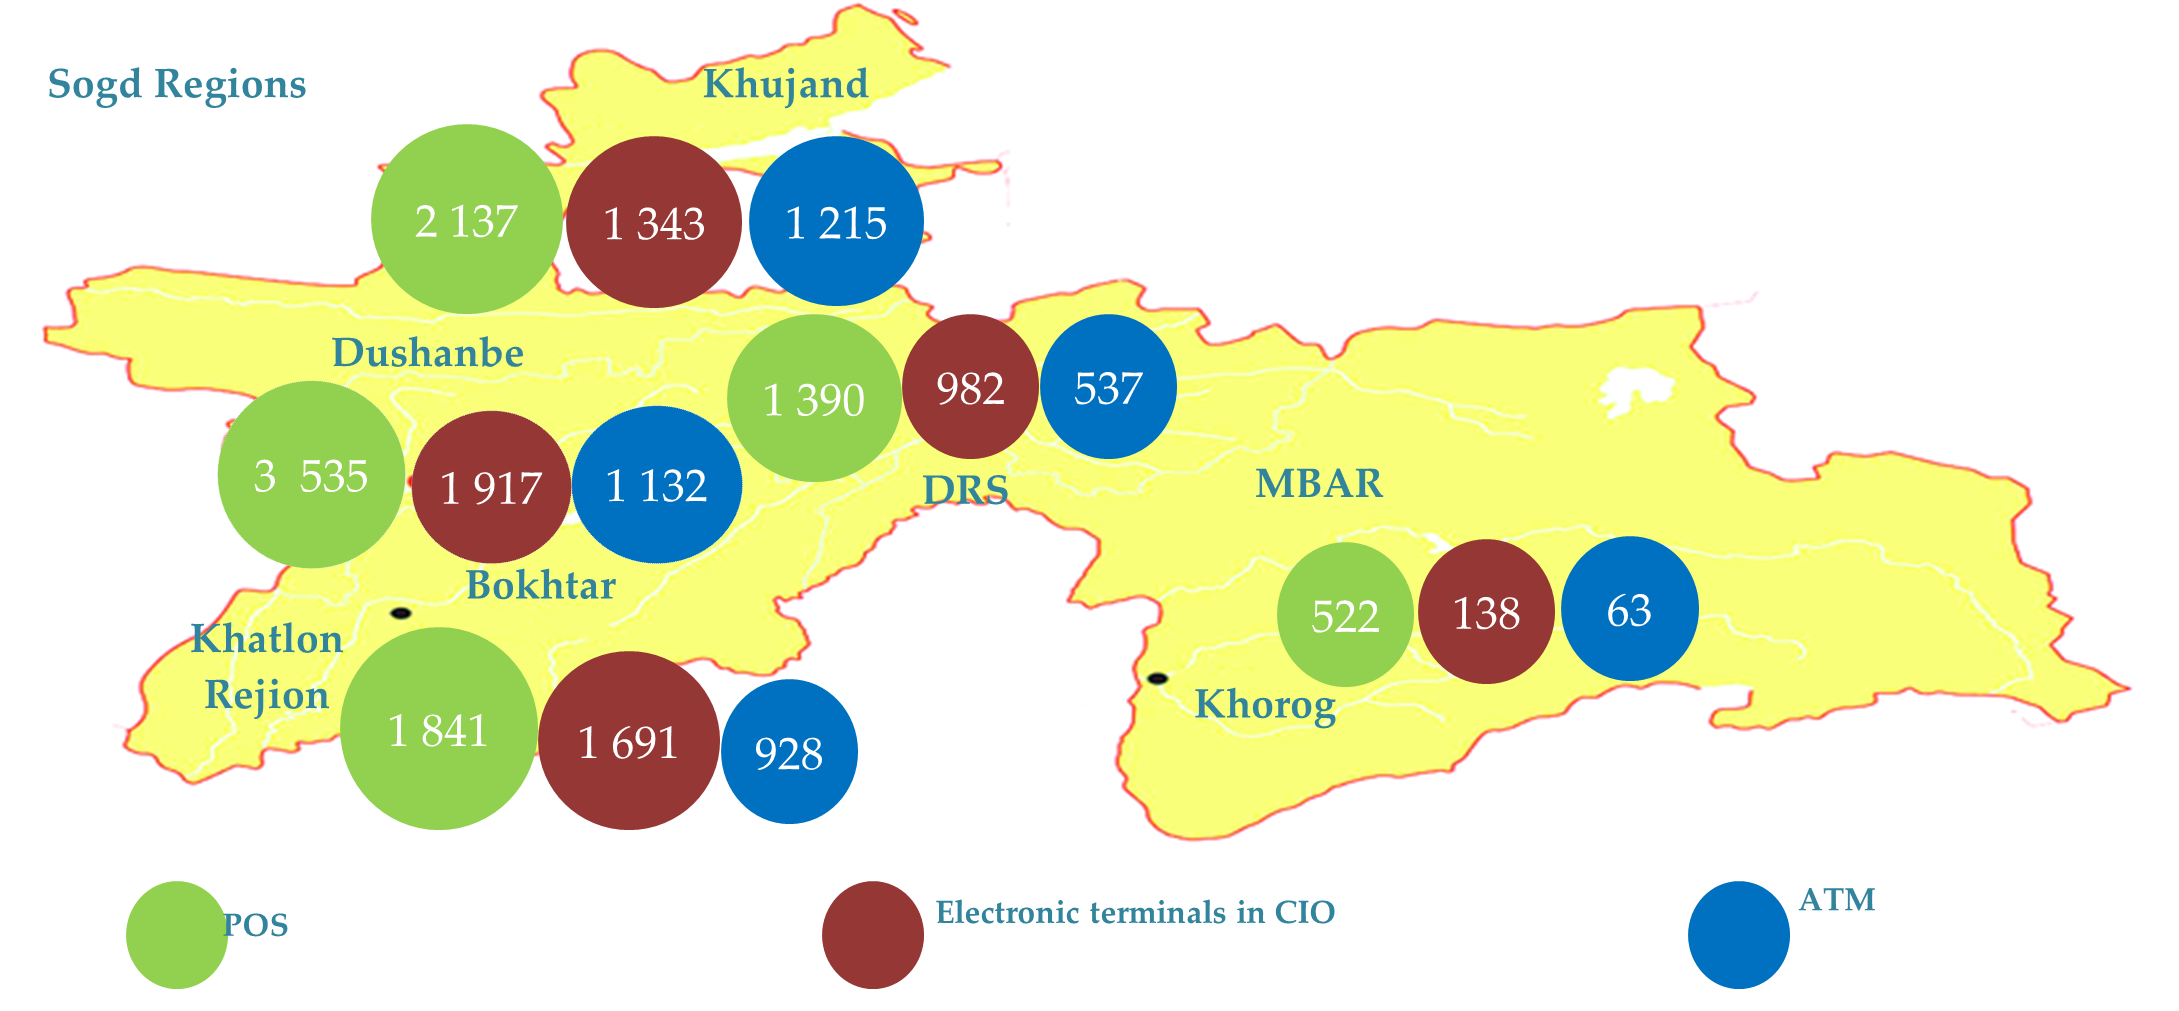
Credit financial institutions have installed 3 875 ATMs and 6 071 electronic terminals at cash supply points (CSPs) to provide cash to bank payment card holders. These indicators are 19.9% and 58.1% higher than the same period in 2025. In addition, 9 425 POS terminals were installed at trade and service points for accepting non-cash payments for goods and services, which is 10.5% more than the same period in 2025. Also, 33 620 QR codes were installed in trade and service enterprises, compared to the same period in 2025, their number increased by 32.4%.
The number of automatic self-service terminals equaled 6 987 units as of the reporting date.
During this period, the share of cashless payments for goods and services using electronic payment instruments amounted to 41 percent overall, increasing by 13 percentage points compared to the same period of 2025.
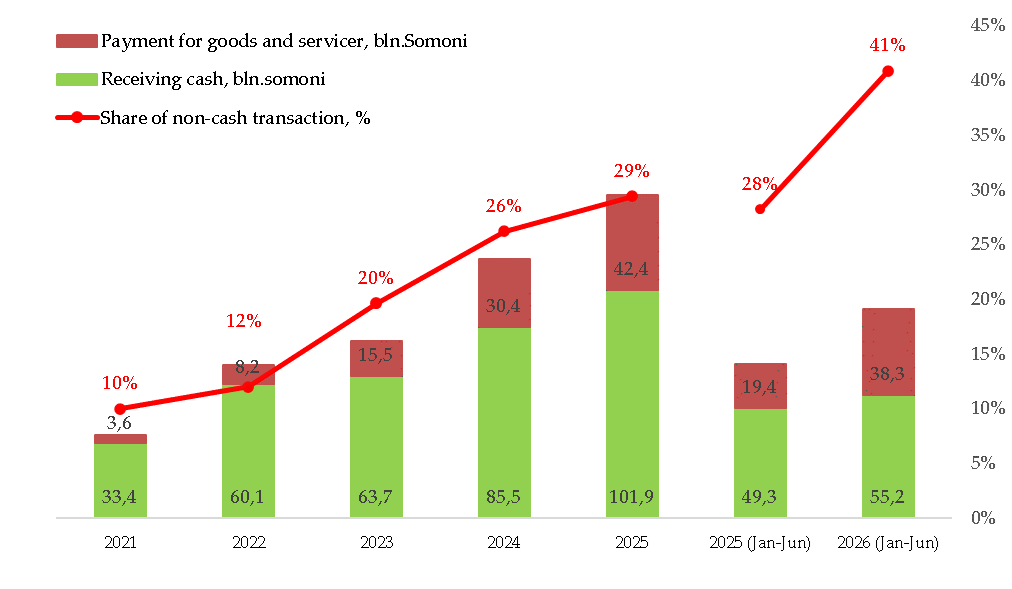
Cashless transactions using electronic payment instruments (bank payment cards and electronic wallets) increased by 1.7 times in terms of number and by 97.6 percent in terms of the volume of transactions carried out.